Fig. 4.

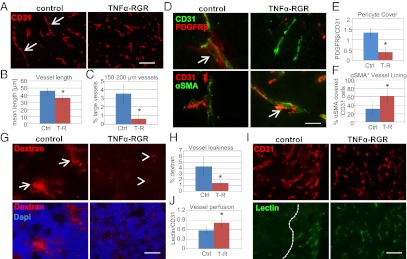
Tumor-targeted TNFα stabilizes vessels and enhances vascular functionality. (A) Representative pictures of CD31-positive vessels in control (untreated) RIP1-Tag5 tumors and after 2 wk of treatment with 2 μg of TNFα-RGR. Arrows point at large vessels. (Original magnification: 20×.) (Scale bar: 100 μm.) (B) Quantification of mean vessel length in control (Ctrl) and treatment groups (T-R, TNFα-RGR) (P = 0.01). (C) Quantification of percentage of large vessels (size: 150–200 μm) (P = 0.003). (D Upper) CD31+ vessels (green) and coverage with PDGFRβ+ pericytes (red). Arrow points at a pericyte-covered area in controls. (Lower) CD31+ vessels (red) and association of αSMA+ perivascular cells (green). Arrow points at close vascular lining in TNFα-RGR treated tumors. (Original magnification: 40×.) (Scale bar: 50 μm.) (E) Ratio of PDGFRβ-positive pericytes to CD31-positive endothelial cells (P = 0.003). (F) Percent αSMA+ covered endothelial cells (P = 0.02). (G) Vascular permeability assessed by injection of 70-kDa Texas-red labeled dextran followed by saline perfusion. (Upper) Dextran signals in tumors. Arrows point at areas of dextran extravasation. Arrowheads point at residual dextran associated with vessels. (Lower) Dextran/dapi double staining. (Original magnification: 20×.) (Scale bar: 100 μm.) (H) Quantification of percentage of dextran in tumors as readout for vascular leakiness (P = 0.02). (I) CD31-positive vessels (Upper) in relation to i.v. injected FITC-lectin (Lower). Dashed line indicates perfused and nonperfused tumor areas. (Original magnification: 20×.) (Scale bar: 100 μm.) (J) Ratio lectin-positive vessels to CD31-positive vessels (P = 0.03, n = 3–8 for all groups).
