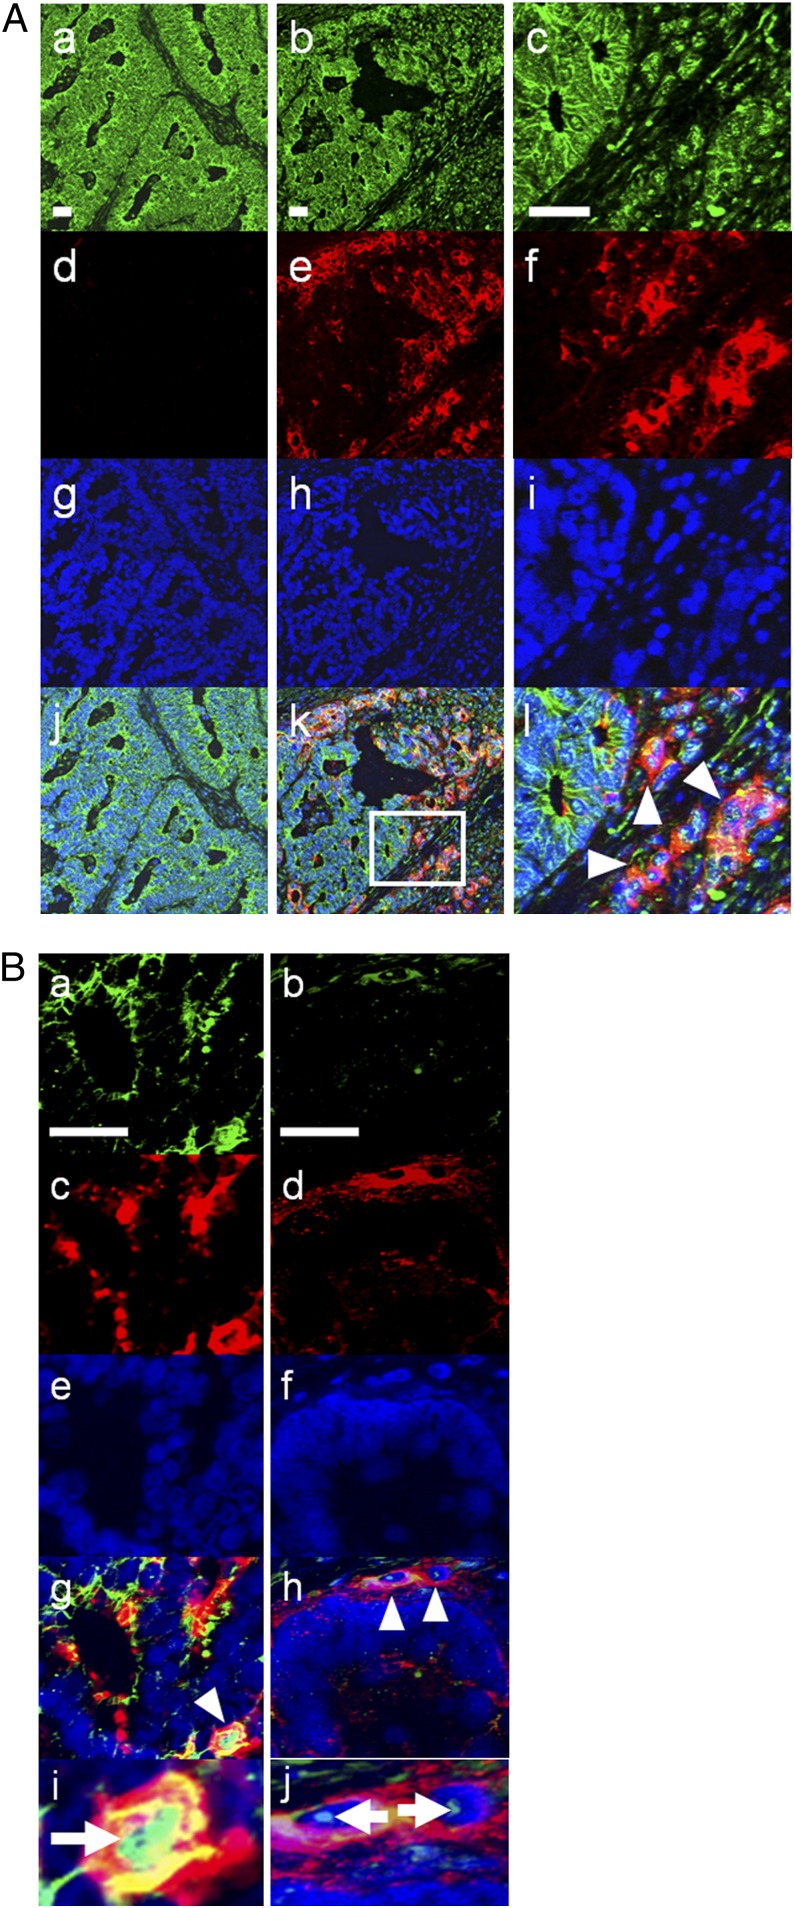
Fig. 5.
E-selectin ligand glycan expression on colon cancer cells undergoing EMT in vivo. (A) Expression of E-cadherin (green) and sLea (red) was examined on human colon cancer sections by immunohistochemistry. (Left) Region with cancer cells exhibiting high cell-surface E-cadherin expression. (Center) Another region in the same section containing cancer cells without cell-surface E-cadherin expression, a part of which are surrounded by a square (k) and magnified in the Right column. Arrowheads indicate cells with decreased E-cadherin and increased sLea expression on the cell surface. (Blue) Hoechst 33342. (B) Expression of SNAIL1 (a, green), ZEB1 (b, green), and sLea (c and d, red) was examined on sections from the same patient. (e and f) Hoechst 33342. Cells with arrowheads (g and h) are magnified (i and j), with arrows showing nuclear SNAIL1 and ZEB1, respectively. (Scale bars, 50 μm.)

