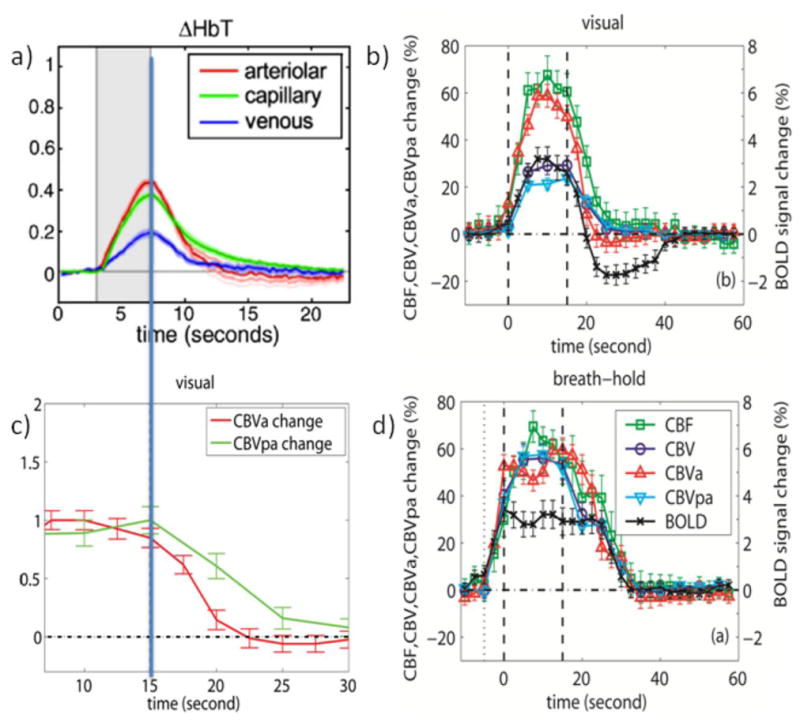
Figure 2.

a) Average arteriolar, capillary and venous hemodynamic responses (CBV based on total Hb count) to somatosensory (forepaw) stimulation for 5 rats as obtained from depth-resolved optical imaging and in-vivo two-photon microscopy. Stimulation period in gray. Reprinted from Hillman et al., 2007, Neuroimage 35, 89. b) Average hemodynamic responses (n = 11) for CBF, CBV, CBVa, CBVpa, and GRE-BOLD obtained for visual activation (neuronal stimulation, 15s) in humans. Stimulation periods indicated by vertical dashed lines. c) normalized CBVa and CBVpa responses from (b). d) Average hemodynamic responses (n = 11) during and after brief breath hold (vascular stimulation, 5s exhale + 15s hold). Curves in (b,d) are from significantly activated voxels that overlap for all methods and for both visual and breath hold paradigms and thus of similar tissue/vessel composition. Error bars indicate inter-subject standard deviation. Notice the slow vascular (CBV and CBF) post-stimulus return to baseline for breath hold compared to visual activation as well as the lack of a post-stimulus undershoot following vascular stimulation despite the delayed vascular compliance. Also note the lack of a CBF PSU. Figures b-d were generated from the data used for Figures 1 and 2 of Hua et al., 2011, J. Cereb. Blood Flow Metab. 31, 1599; reprinted with permission.
