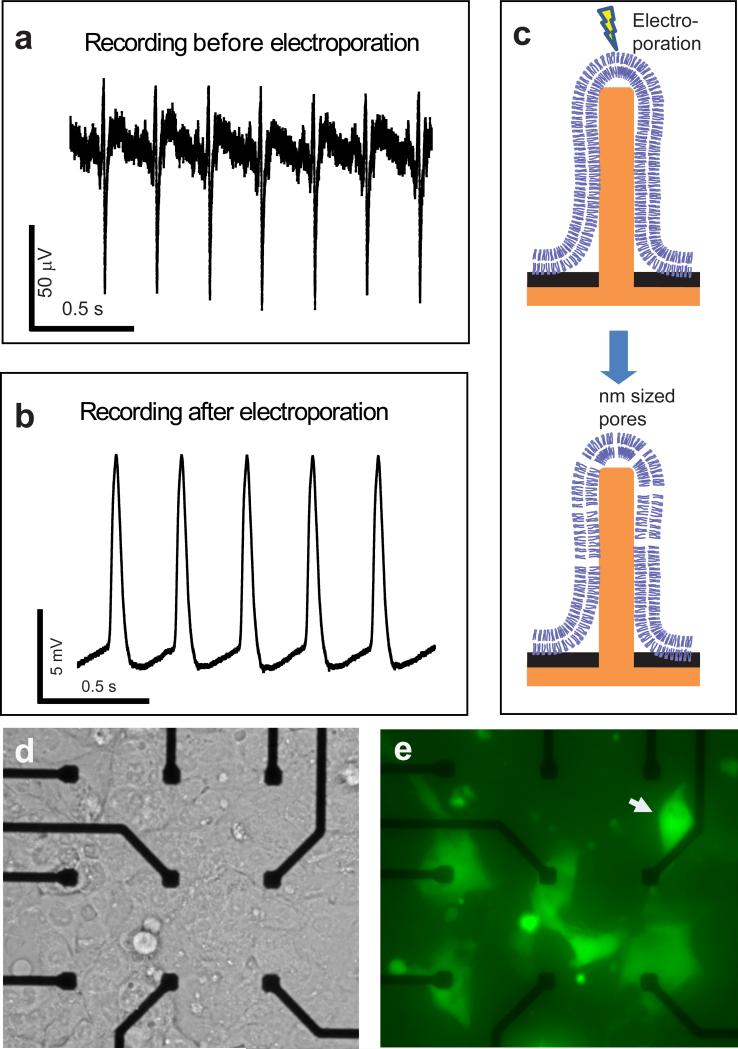
Figure 2. Nanopillar electrode extracellular (intracellular) recording of action potentials of a single HL-1 cell before (after) electroporation.
(a) Before electroporation, the recorded train of action potentials shows extracellular signatures. (b) After electroporation, the recorded signal amplitude increases over 100 times and the shape exhibits intracellular features. (c) A schematic illustration of electroporation of the surrounding cell membrane by a nanopillar electrode. Voltage pulses create nanometer-sized pores on the cell membrane immediately surrounding the nanopillar electrode. The drawing is not to scale. (d, e) Nanopillar electroporation is confirmed by entry of membrane-impermeant calcein dye. (d) shows a bright field image of confluent HL-1 cells covering nine Pt pads. Of the nine Pt pads, the six pads in the second and third rows have nanopillar electrode arrays. To serve as a control, the three pads in the topmost row have only milled holes but no nanopillars. (e) The corresponding fluorescence image of the same area shows that calcein dye enters only those cells that contact the nanopillar electrodes. No electroporation is observed on the top three control pads. Dye entry to single cells on every electrode indicates that each nanopillar electrode array (each with 9 nanopillars) interfaces with only a single cell. The cell on the top right (white arrow) is off-site from the electrode, but its membrane protrusion extends to the nearest nanopillar electrode site as shown in higher contrast in Supplementary Fig. S2.

