Figure 4.

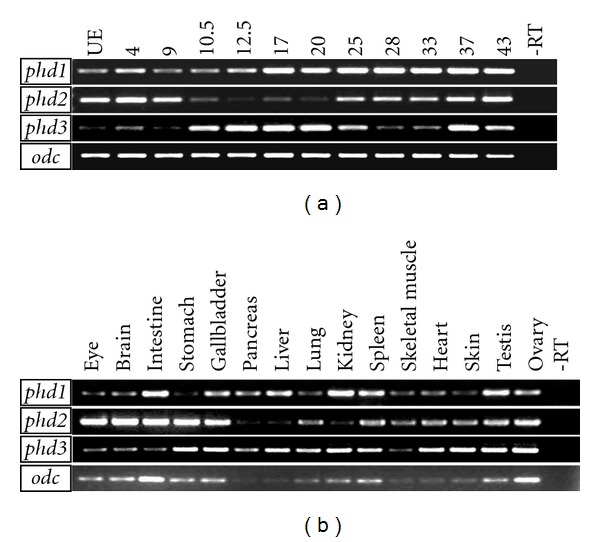
Temporal expression profile and adult tissue expression patterns of phd1, 2, and 3 revealed by RT-PCR analyses. (a) Temporal expression profile of phd1, 2, and 3 in Xenopus embryos. (b) Expression of phds in Xenopus adult tissues. odc was employed as a loading control. UE: unfertilized eggs.
