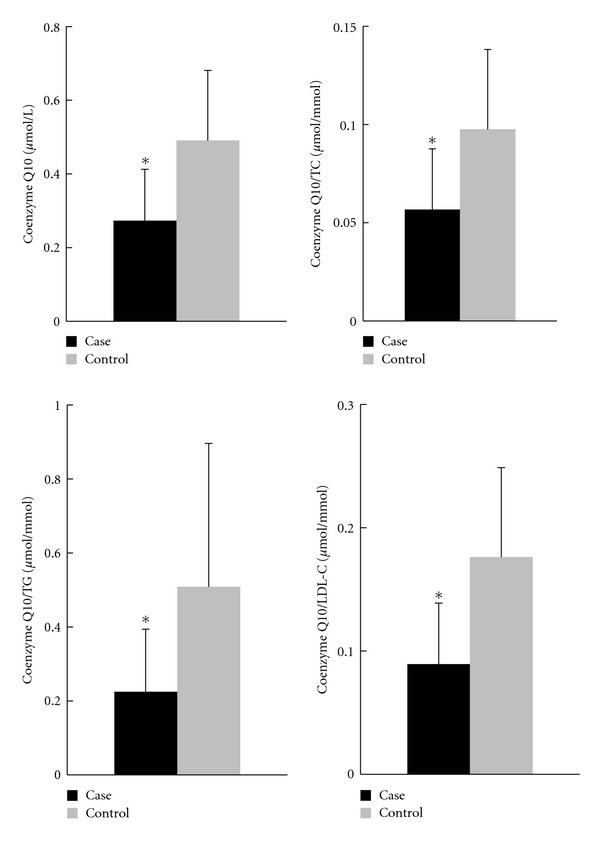
Figure 1.

Concentrations of plasma coenzyme Q10 and the ratios of coenzyme Q10 to lipid profiles. *Values were significantly different between case and control groups; P < 0.01. LDL-C: low density lipoprotein-cholesterol; TC: total cholesterol; TG: triglyceride.
