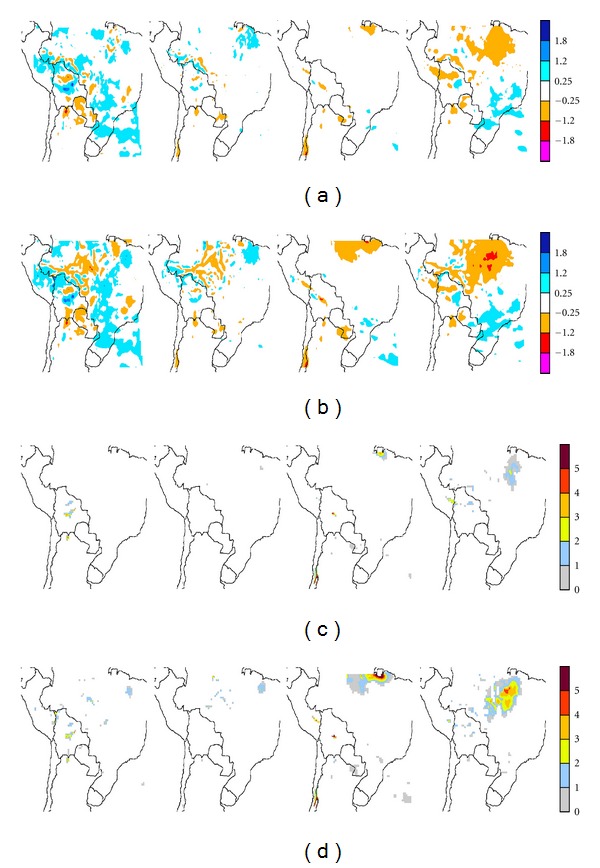
Figure 8.

Seasonal precipitation changes, in mm day−1, resulting from the two deforestation/land-use scenarios in ECHAM-4 Baseline driven PRECIS runs, for (a) MAP1 and (c) MAP2. The corresponding significances at least at the 90% level are shown in (b) and (d), respectively. Starting from the left the columns correspond to summer (DJF), autumn (MAM), winter (JJA), and spring (SON).
