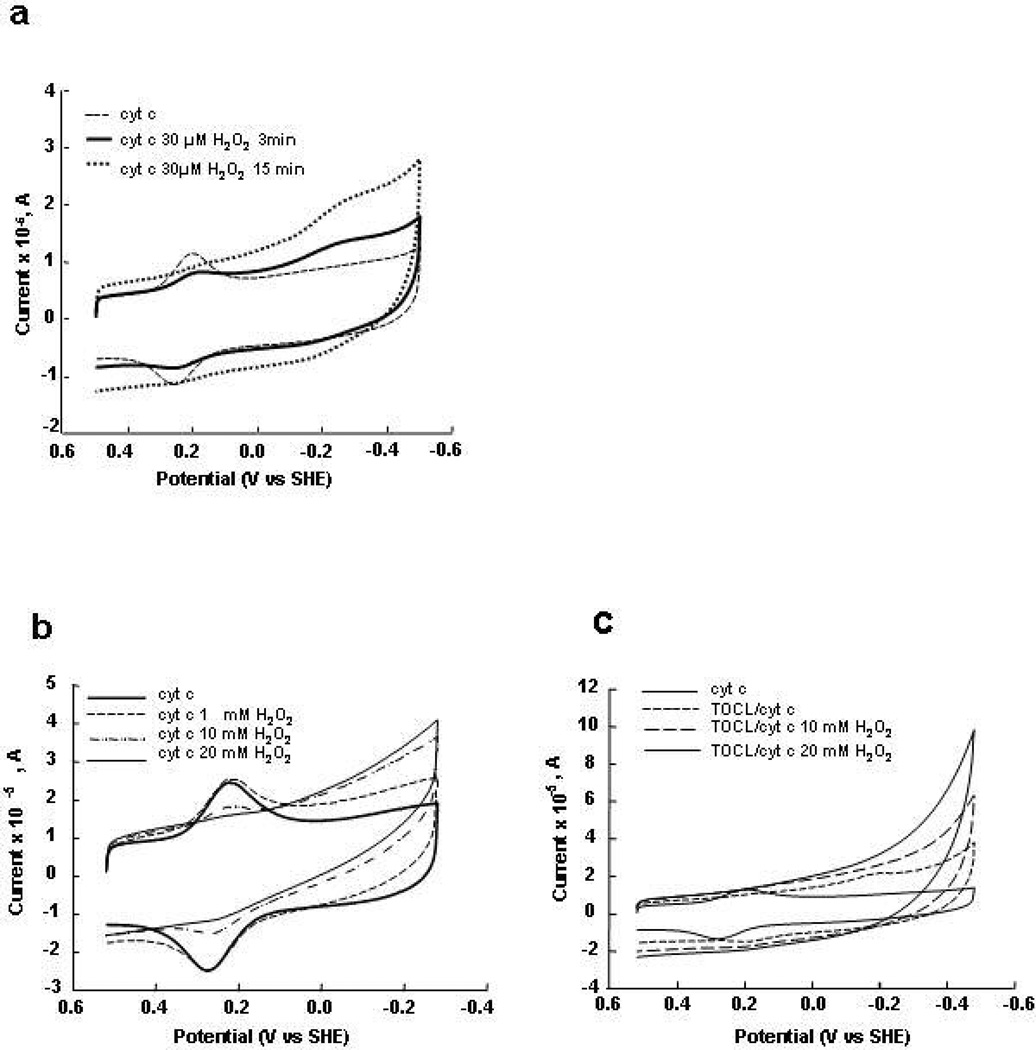
Figure 8.
Cyclic voltammograms of cyt c electrostatically attached to carboxylic acid - terminated in the absence (dashed line) and the presence of 30 µM H2O2 after 3 (solid line) and 15 (dotted line) min incubation with H2O2. (a) Cyclic voltammograms of cyt c covalently attached to SAM at different concentrations of H2O2 in the absence (b) and presence of TOCL/DOPC liposomes (c). Cyt c was incubated with liposomes during 60 min and then H2O2 was added. The voltammograms were recorded after pre-incubation with H2O2 during 15 min under N2. The voltammograms of cyt c without liposomes at pH 7.0 are shown for comparison on both figures (solid line). Scan rate 20 V/s.

