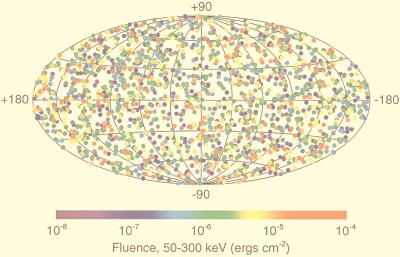
Figure 1.
Distribution on the sky of 1,825 GRBs observed by BATSE. The map shows burst locations (without indicating position uncertainties) in galactic coordinates. There are no preferred directions, either of galactic or extragalactic significance. Color code indicates total burst energy. Bursts are distributed isotropically, independent of their brightness, duration, spectrum, or any other characteristic.

