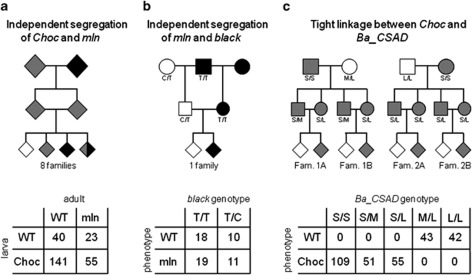
Figure 2.
Analysis of linkage of melanism loci. Top: schematic representations of the experimental crosses used to test for linkage between loci responsible for larval Choc and adult mln phenotypes (a), between mln and candidate gene Ba_black (b), and between Choc and candidate gene Ba_CSAD (c). Different phenotypes are represented by color: gray for Choc melanic larvae (with WT-colour adults), black for mln melanic adults (with WT-colour larvae), and white for WT larval and adult coloration. Males are shown as squares, females as circles and diamonds represent offspring of both sexes. Bottom: tables showing the numbers of offspring in each phenotypic/genotypic class (details about the mapping families in Supplementary Tables S1 and S2). DNA sequence polymorphisms used to genotype the individuals in (b) and (c) are explained in the text.

