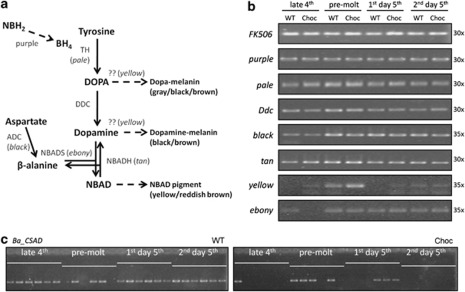
Figure 4.
Melanin pathway and semi-quantitative PCR of key genes in WT and Choc larvae. (a) A simplified schematic representation of the melanin pathway (adapted from Arakane et al., 2009; Zhan et al., 2010; Futahashi et al., 2010): enzymes are shown in gray with corresponding genes in brackets; arrows indicate reactions catalyzed by each enzyme (dashed arrows correspond to multi-step reactions). TH, tyrosine hydrolase; putative DCE, dopachrome conversion enzyme (note that the exact function of the yellow gene is still unclear); DOPA decarboxylase (DDC), dopa decarboxylase; ADC, aspartate decarboxylase; NBADS, N-beta-alanyldopamine synthase; NBADH, N-beta-alanyldopamine hydrolase; NBH2, dihydroneopterin; BH4, tetrahydrobiopterin. (b) Relative expression levels of the control FK506 and seven melanin pathway genes in larval integument around the last larval molt (stages indicated on top). PCR reactions (number of cycles on the right) were run on six replicate individuals per stage per phenotype (Supplementary Figure S1) and, for illustration, also on pools of replicates (shown here). (c) Semi-quantitative analysis of Ba_CSAD expression in WT and Choc larvae, performed at 35 cycles on six individuals for each stage and phenotype (data for 30 and 38 cycles is shown in Supplementary Figure S1). The fact that PCRs worked for both phenotypic groups at some stage assures that lack of amplification is unlikely to be caused by putative sequence differences between populations.

