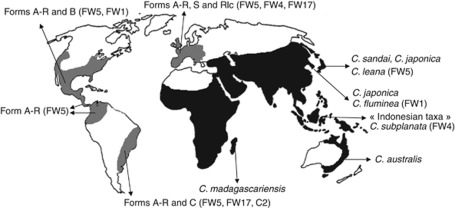
Figure 4.
Schematic map showing the current distribution of the main lineages of Corbicula spp. Native and invasive approximate ranges are indicated in black and gray, respectively (modified from McMahon, 1999; Lee et al., 2005). Morphotypes are indicated and corresponding mitochondrial haplotypes (COI) are within parenthesis.

