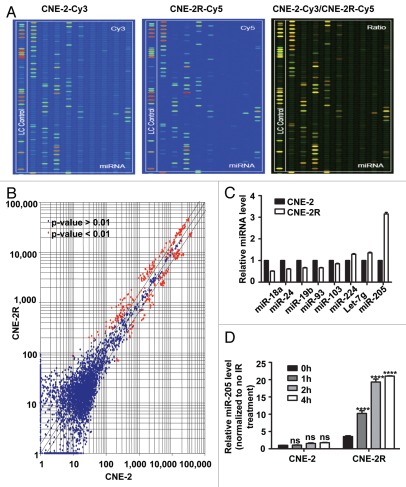
Figure 2.
miR-205 is elevated in radio-resistant NPC cells. (A) miR expressing signals from CNE-2 or CNE-2R. miRNAs from CNE-2 or CNE-2R were labeled with Cy3 or Cy5 respectively. (B) Scatter plot of miR expression profiles in radiosensitive CNE-2 (x-axis) and radio-resistant CNE-2R cells (y-axis). The miRs differentially expressed with statistical significance were marked in red. (C) Differential miR expression between CNE-2 and CNE-2R. Relative expression levels of several representative miRs with differential expression levels were presented. (D) Relative miR-205 expression level is different between CNE-2 and CNE-2R after IR. Quantification by qRT-PCR of miR-205 expression level in CNE-2R and CNE-2 cells before and after IR. U6 was used for normalization. Data were presented as mean ± SEM (n = 3). ns, no significance; *p < 0.05; **p < 0.01; ***p < 0.001.

