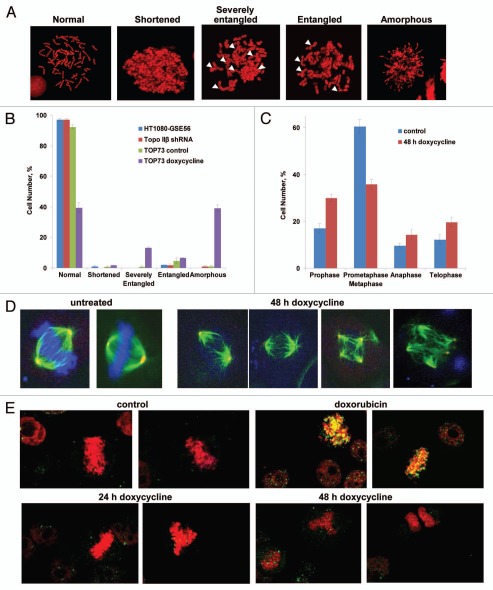
Figure 4.
Morphological analysis of changes in mitosis of TOP73 cells upon Topo II depletion. (A) Mitotic spread images of different types of chromosomal morphology. Arrows indicate entangled chromosomes. (B) Distribution of different types of chromosomal morphology in TOP73 cells, untreated or treated for 48 h with doxycycline (107 cells in each group). Means and standard deviations for three independent experiments. (C) Distribution of mitotic phases among mitotic figures of TOP73 cells, untreated (114 cells) or treated for 48 h with doxycycline (111 cells), as determined by immunofluorescence microscopy. Means and standard deviations for three independent experiments. (D) Immunofluorescent images of normal metaphases (control cells), metaphase plates with poorly condensed DNA and multipolar mitoses (doxycycline-treated TOP73 cells). Mitotic cells were stained with DAPI (DNA staining, blue) and with antibodies against α-tubulin (mitotic spindle, green) and γ-tubulin (centrosomes, red). (E) Immunofluorescence analysis of DNA damage in mitotic chromosomes of TOP73 cells, untreated or treated with doxycycline for 24 h or 48 h and in HT1080-GSE56 cells treated with 100 nM doxorubicin for 9 h. Cells were stained with PI (DNA, red) and an antibody against γH2AX, a marker of DNA damage (green).

