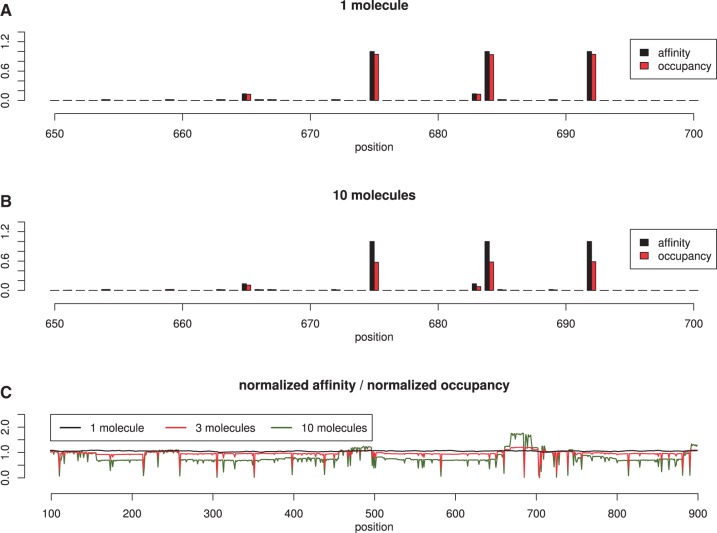
Fig. 3.
Affinity vs occupancy. We consider a random 1000 bp DNA strand and TF molecules which can bind/unbind, hop, jump, slide left/right. In (A) we show the normalized affinity and normalized occupancy for 1 molecule and in (B) for 10 molecules. In (C) we plot the ratio between occupancy and affinity, which should be ~1 for highly correlated values. The Pearson, coefficient of correlation between the the affinity and occupancy slightly drops from 0.999 (in the case of 1 molecule) to 0.998 (in the case of 3 molecules) and, further, to 0.979 (in the case of 10 molecules).

