
Figure 8.
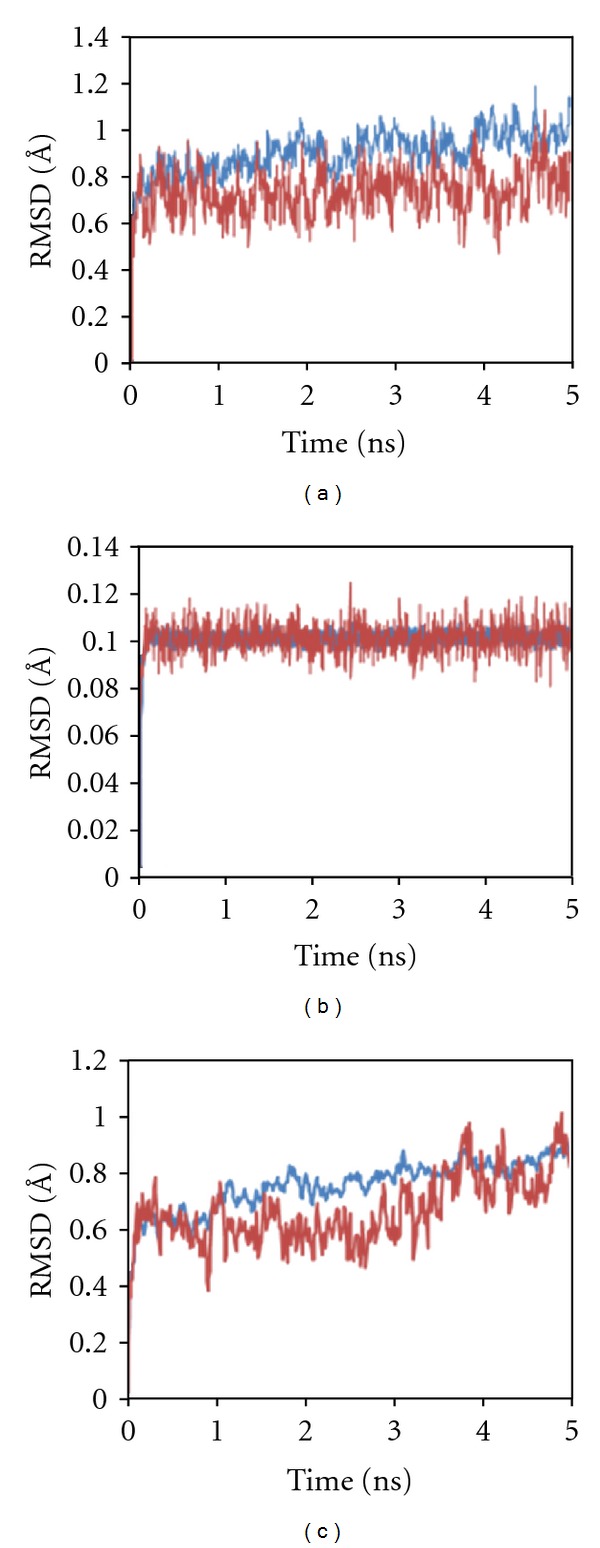
RMSD of backbone is shown for whole protein (blue) and 5 Å regions around the active site of cocrystal ligand (red). The structures, 1Z89 (a) and 3H4G (c), have lower RMSD for active site than whole protein, while 2FZ8 (b) has similar RMSD for both throughout the trajectory.