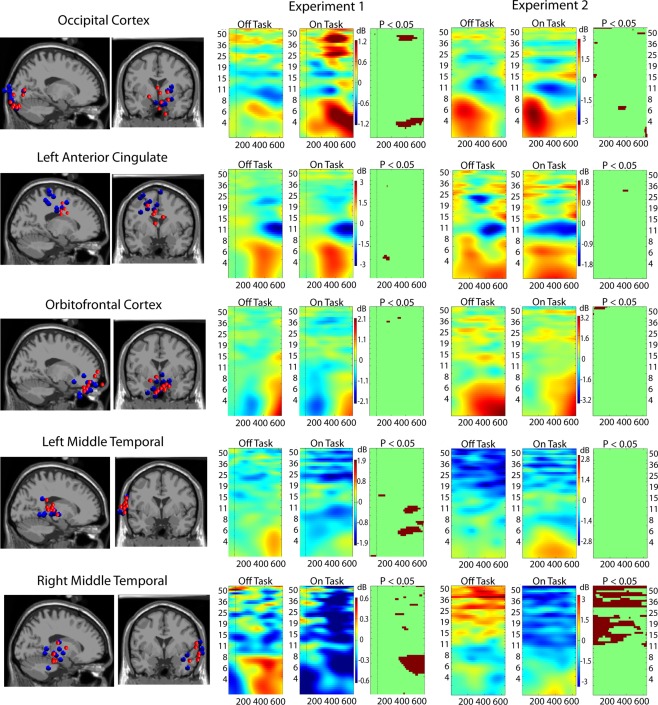
Figure 3.
Event-related spectral perturbation (ERSP) results for ICs localized to five critical brain regions. Leftmost columns show the locations in the brain of clusters of ICs from the two experiments: Experiment 1 in red dots and Experiment 2 in blue dots. Rightmost three columns display ERSP results (Off-task and On-task) and the On-task Off-task difference masked at p = 0.05 by permutation test.

