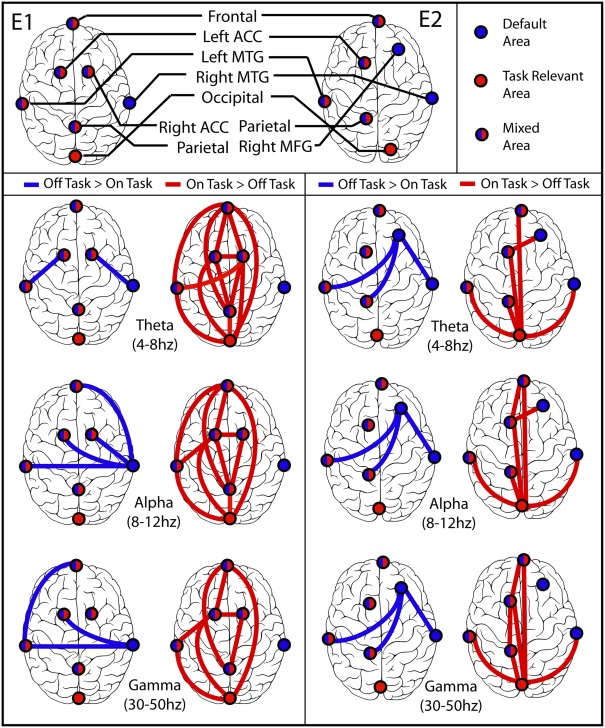
Figure 5.
Synchronization between brain regions. (E1) Experiment 1 on left, (E2) Experiment 2 on right. In each part the left column displays blue lines between regions that were more synchronized during off-task epochs (default network), and the right column displays red lines between regions that were more synchronized during on-task epochs. In all but the Experiment 2 off-task > on-task network, lines are displayed only if both the difference between average PLV was significant at p = 0.001 in the indicated direction and the more significant coherence was also significantly different from zero for most or all of the subjects in the cluster by binomial test at p = 0.001. The off-task network in Experiment 2 passed only the first of these criteria.

