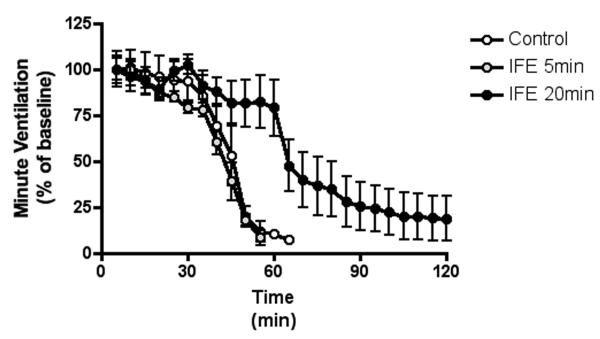
Figure 3.
The decline in minute ventilation after parathion exposure
The decrease in minute ventilation (MV) is shown as percent of baseline to normalize differences between individual animals within groups. The data were averaged into 5-minute bins starting from the time of OP introduction to the 2-hour endpoint of the study. Data are presented as mean (dot) with standard deviation (error bars).

