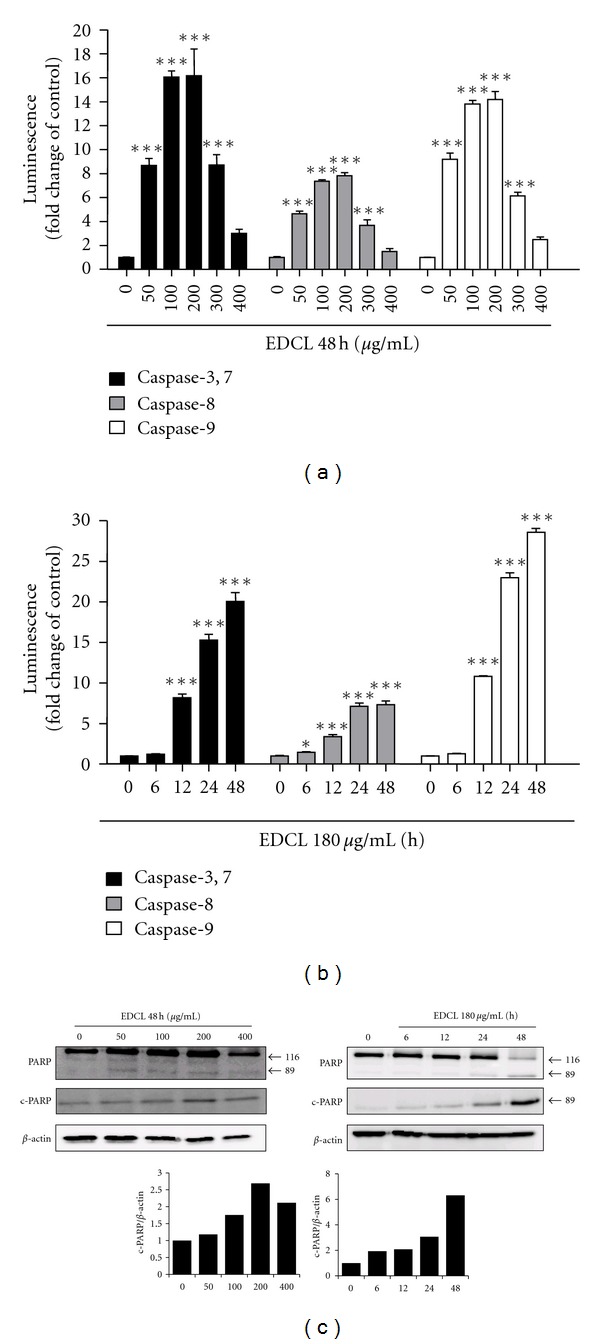
Figure 4.

Exposure to EDCL shows activation of caspases and degradation of PARP protein in HepG2 cells. (a) Concentration response. Cells were incubated in the presence or absence of several concentrations of EDCL for 48 h. (b) Time course. Cells were incubated in the presence or absence of 180 μg/mL EDCL for different lengths of time. Upon completion of each exposure time, caspase activity was assessed using a Caspase-Glo assay kits assay, as described in Section 2. The data are expressed as the means ± SD of triplicate samples. *P < 0.05 and ***P < 0.001 versus untreated EDCL. (c) Cells were subjected to Western blot analysis using anti-PARP and anti-c-PARP antibodies. Western blot signals were quantified and normalized to β-actin.
