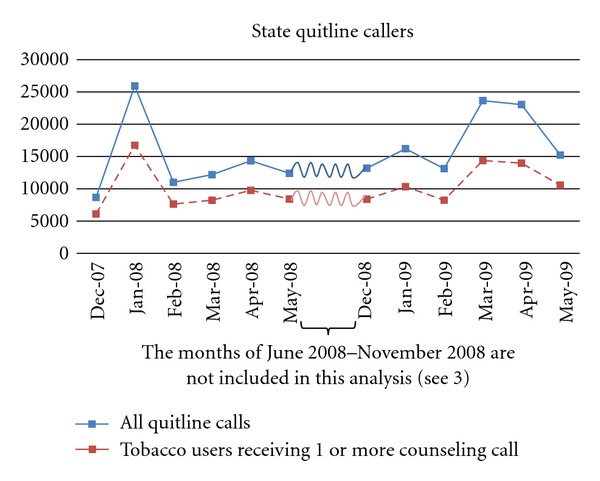
Figure 1.

Monthly number of calls and number who received counseling from 16 state quitlines, December 2007 through May 2009 ((1) See Table 1 for a description of services within the participating states. (2) All quitline calls (top line) include proxy callers, providers, general public, “hang ups,” tobacco users wanting materials only, seeking treatment, or those enrolled who call back to speak with coach. Tobacco users (bottom line) represent those enrolled in the quitline who completed at least one counseling call. (3) The spike in January 2008 is primarily due to a cigarette tax increase in one large state and associated promotional activities. Call volumes tapered after May 2008 and May 2009, thus data from May 2008–November 2008 and after May 2009 are not included in the graph).
