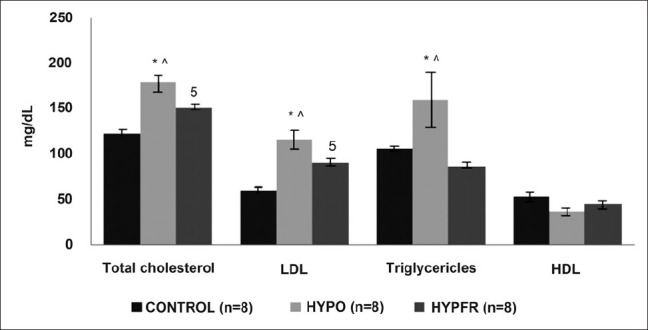
Figure 2.

Effect of altered thyroid state on the lipid profile in study population. Values are represented as Mean + SEM. *EU vs. HR, $EU vs. HO, #HR vs. HO, ∧HO vs. HR (P < 0.05)

Effect of altered thyroid state on the lipid profile in study population. Values are represented as Mean + SEM. *EU vs. HR, $EU vs. HO, #HR vs. HO, ∧HO vs. HR (P < 0.05)