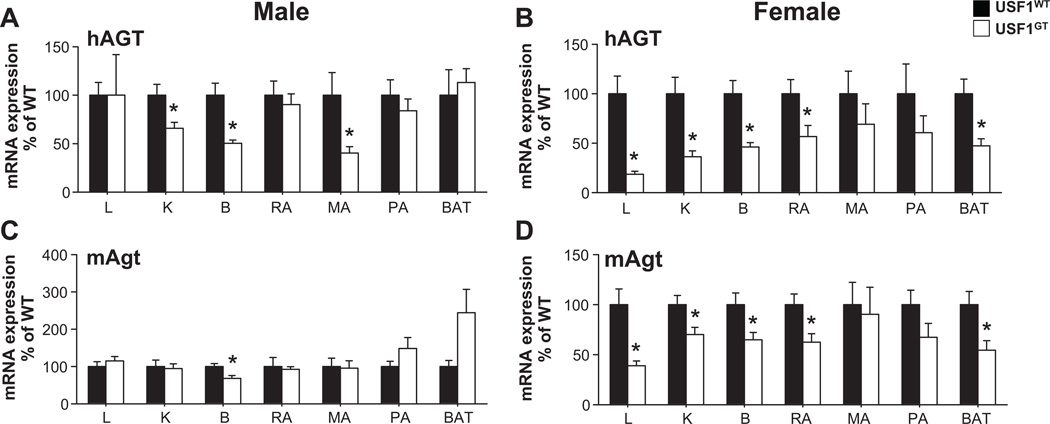
Figure 3. hAGT and mAgt mRNA expression in USF1GT liver.
Expression of hAGT (A–B) and mAgt (C–D) in tissues from male (A, C) and female (B, D) USF1WT and USF1GT mice. Liver (L), Kidney (K), brain (B), and adipose tissues (reproductive adipose; RA, mesenteric adipose; MA, perirenal adipose; PA and brown adipose; BAT) of mice. Each n≥7, *<0.05 vs. USF1WT. All data presented as mean±SEM.

