Fig. 6.
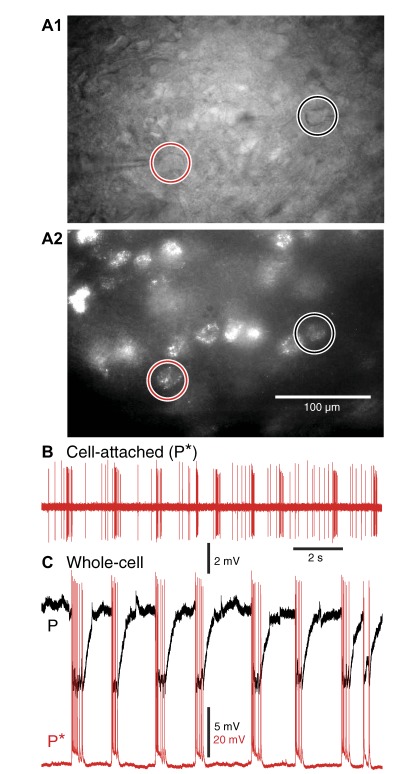
A subset of projection cells (P*) undergo depolarization and spiking during the spontaneous IPSPs seen in most projection cells (P). The photomicrographs in A1 and A2 show the same BA region in brightfield mode (A1) or with FITC filter (A2). Red and black circles, respectively, mark the retrogradely labeled P* and P cells that were simultaneously recorded. B: cell-attached recording of P* cell shown in A and C. C: activity of simultaneously recorded P* and P neurons (same cells as in A) shows that periods of firing in P* cell coincides with IPSPs in P cell. Rest was −76 mV for the P cell and −71 mV for the P* cell.

