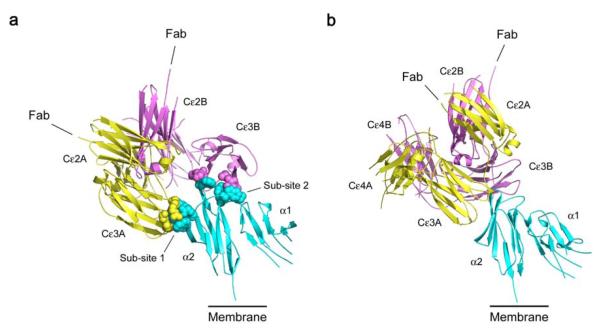
Figure 1.
Overall structure of the IgE-Fc/sFcεRIα complex, in two approximately orthogonal views. sFcεRIα is colored in blue, IgE-Fc chain A in yellow and chain B in purple. a) The extensive interface with two distinct sub-sites, one on each Cε3 domain, is indicated with a space-filled representation of the interacting side-chains. The Cε4 domains are hidden in this orientation. b) The acute bend, with the pair of Cε2 domains packed against the Cε3 and Cε4 domains, can be seen clearly. The connections to the Fab regions are indicated, and the bend in the IgE molecule ensures that they are oriented away from the membrane (see also Supplementary Video 1).

