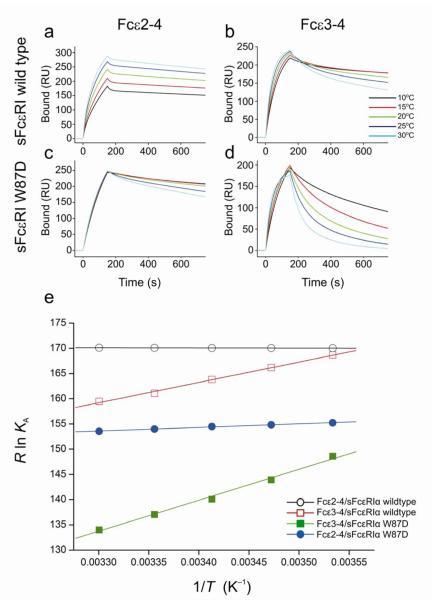
Figure 4.
Thermodynamics of the IgE/FcεRI interaction. SPR sensorgrams of Fcε2-4 (IgE-Fc) and Fcε3-4 binding to immobilized sFcεRIα wildtype (a & b), and to immobilized sFcεRIα W87D (c & d), over a range of temperatures. A series of analyte concentrations were tested; sensorgrams for a single concentration point (125 nM) are shown for each temperature (see Supplementary Figs. 5 and 6 for full range of concentration data). (e) The van’t Hoff plot illustrates the temperature dependence of the equilibrium binding affinities for Fcε2-4/sFcεRIα wildtype, Fcε2-4/sFcεRIα W87D, Fcε3-4/sFcεRIα wildtype, and Fcε3-4/sFcεRIα W87D. The fits for both Fcε2-4 interactions are linear (R > 0.99), whereas the Fcε3-4 interactions show small deviations from linearity (R = 0.96–0.98), consistent with a minor contribution from ΔCp. The derived thermodynamic parameters are summarized in Table 2.

