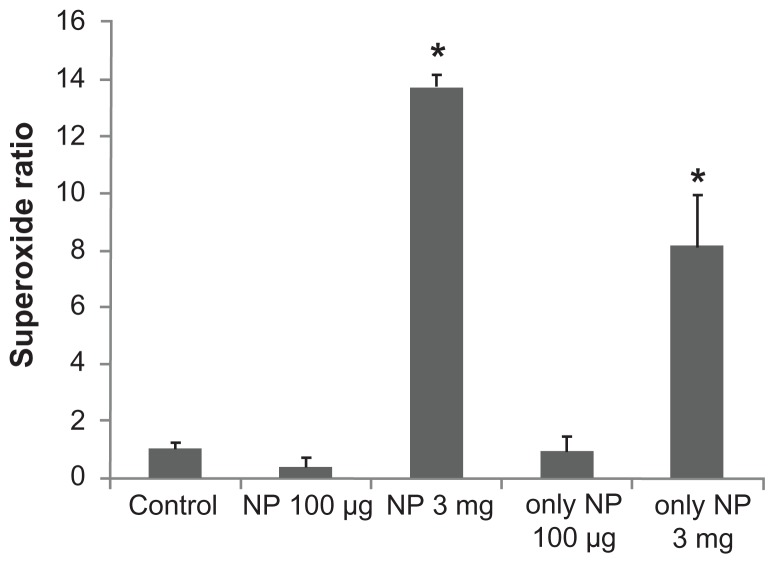
Figure 8.
The effect of Fe3O4 NPs on superoxide production in GH3 cells. The experiments were conducted in cells bathed in Ca2+-free Tyrode’s solution. Bar graph showing summary of the effects of Fe3O4 NPs (100 μg/mL and 3 mg/mL) with or without GH3 cells (mean ± standard error of the mean; n = 4–5 for each bar).
Note: *Significantly different from control.
Abbreviation: Fe3O4 NPs, magnetite nanoparticles.

