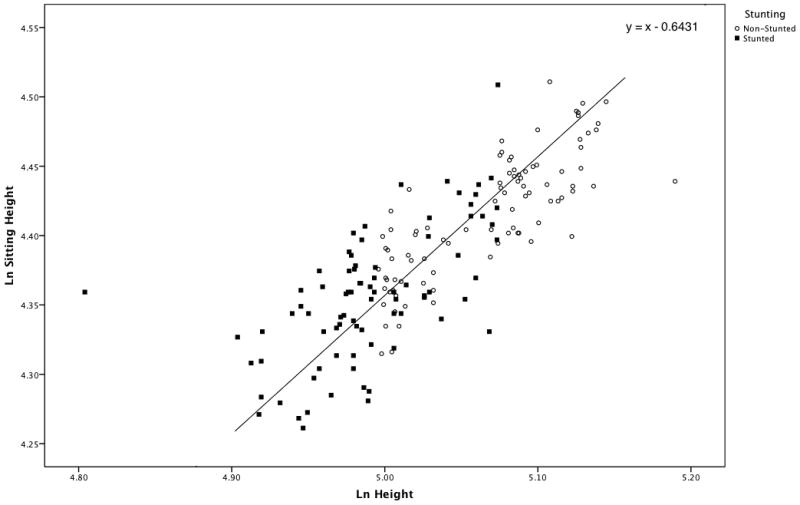
Figure 2.

Scatter plot of Sitting Height over Height for stunted and non-stunted individuals, sexes combined. The line has a slope of 1.0 and passes through the grand mean (5.029, 4.385) of the samples. Stunted individuals tend to cluster above the line, indicating that they are characterized by relatively shorter legs, while non-stunted individuals, who are more numerous below the line, exhibit relatively longer legs.
