
Figure 4.
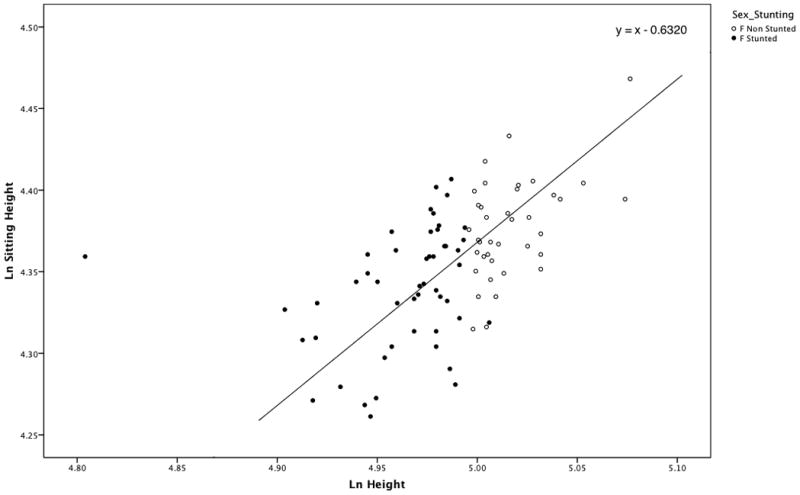
Scatter plot of Sitting Height over Height for stunted and non-stunted females (F). The line has a slope of 1.0 and passes through the grand mean (4.670, 4.678) of the samples. The two samples are equally distributed above and below the line, indicating that there are no differences in body proportions between stunted and non-stunted individuals.