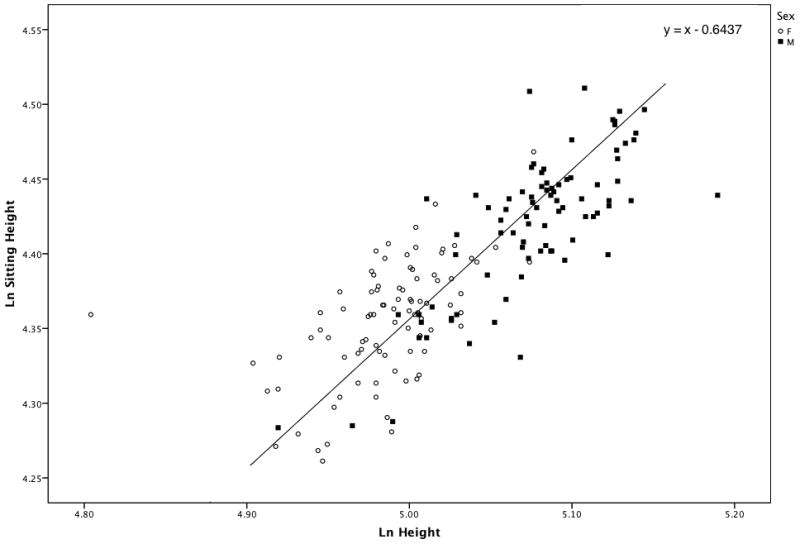
Figure 5.

Scatter plot of sitting height over height for males (M-squares) and females (F-circles). The line has a slope of 1.0 and passes through the grand mean (5.031, 4.388) of the samples. Females tend to cluster above the line, and males below the line, indicating that they have relatively shorter legs than males.
