FIG. 2.

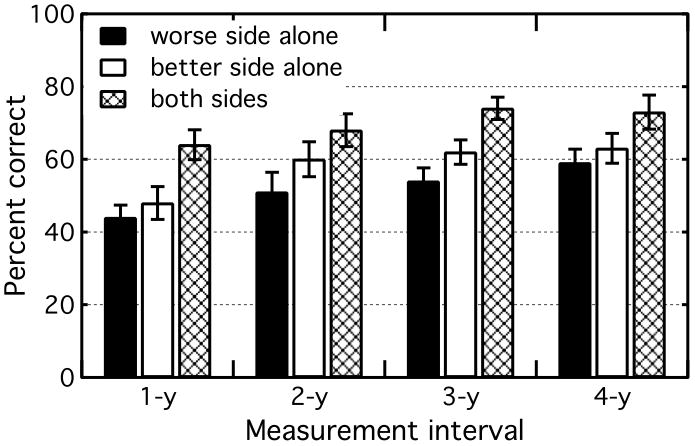
A comparison of percent correct for CNC words in quiet over time. Bar shading reflects listening condition: worse side alone (black), better side alone (white), or bilateral (hatched bars). Error bars show 1 standard error of the mean.

A comparison of percent correct for CNC words in quiet over time. Bar shading reflects listening condition: worse side alone (black), better side alone (white), or bilateral (hatched bars). Error bars show 1 standard error of the mean.