
Fig. 2.
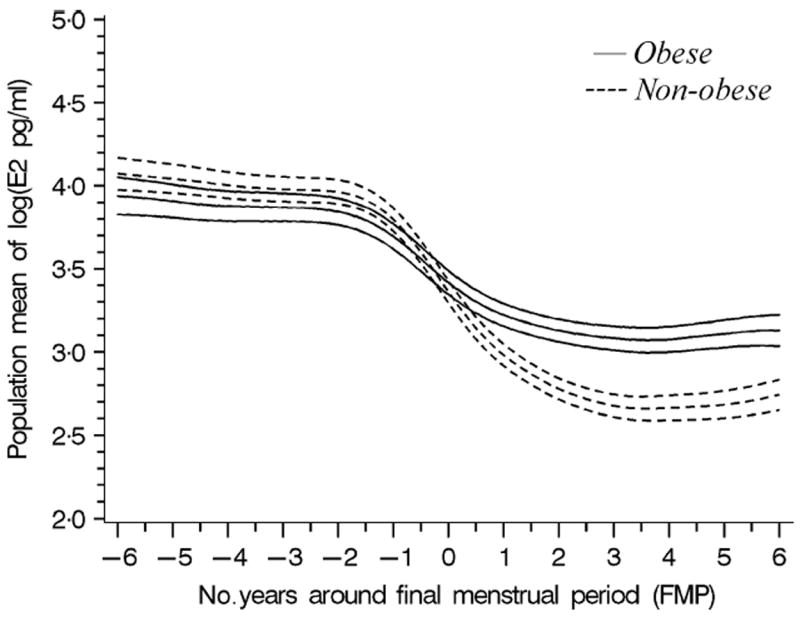
The modelled population mean change in logE2 (with 95% confidence bands) around the FMP in nonobese women (BMI<30, dashed lines) and obese women (BMI>30, solid lines).
Official websites use .gov
A
.gov website belongs to an official
government organization in the United States.
Secure .gov websites use HTTPS
A lock (
) or https:// means you've safely
connected to the .gov website. Share sensitive
information only on official, secure websites.
The modelled population mean change in logE2 (with 95% confidence bands) around the FMP in nonobese women (BMI<30, dashed lines) and obese women (BMI>30, solid lines).