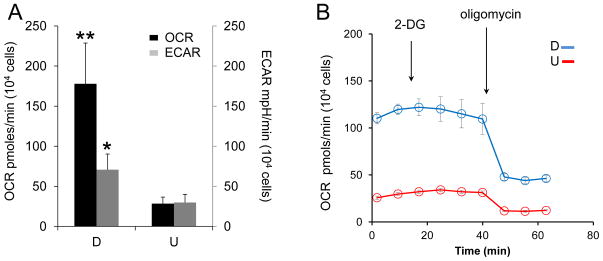
Figure 4. RA treatment increases both glycolysis and oxidative phosphorylation in SH-SY5Y cells.
(A) Oxygen consumption rate (OCR, black bars, left y-axis) and extracellular acidification rate (ECAR, gray bars, right y-axis) in differentiated cells (D) are elevated relative to undifferentiated cells (U). Data shown are the average ± SD of three independent samples. Each sample was subjected to multiple measurements (n≥16) on a seahorse XF96 cell culture microplate. (B) The response of OCR with time after 2-DG (100 mM) and oligomycin (2 μg/ml) injection in D (blue) and U (red) cells, respectively. Blocking of glycolysis with 2-DG does not significantly alter the OCR values and the relative differences in OCR between D and U cells. Data shown are the average ± SEM (n = 4). OCR and ECAR were determined using a Seahorse XF96 extracellular flux analyzer. *, p < 0.05; **, p < 0.01 (n = 3, Student's t-test).

