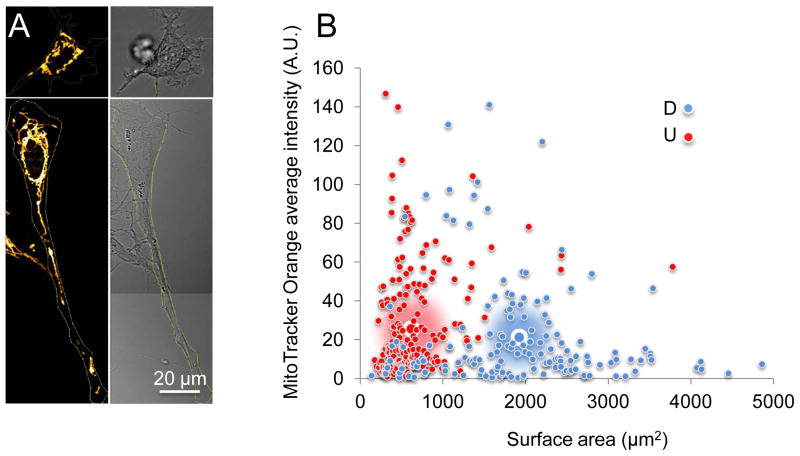
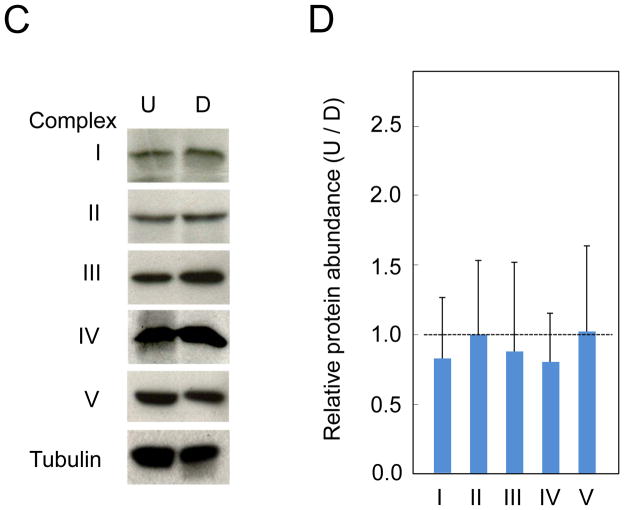
Figure 6. RA treatment does not increase the number of MT or substantially change the composition of the electron transport chain in SH-SY5Y cells.
(A, left) MT of a representative undifferentiated (U) SH-SY5Y cell (top) and a representative differentiated (D) SH-SY5Y (bottom) cell visualized by MitoTracker Orange staining. (A, right) The corresponding bright-field image for A, left. (B) Plot of the average intensity of MitoTracker Orange signal versus cell surface area for D and U cells. Large blue-white circles and large red-white circles indicate the population average for D and U cells, respectively. The MitoTracker Orange intensity normalized to cell surface area is similar between D and U cells. Scale bar is 20 microns. (C) Immunoblots of tubulin, nuclear-encoded subunits in mitochondrial complex I (NDUFB8), complex II (subunit A), complex III (subunit core 2), complex V (ATP synthase subunit beta), and MT-encoded Cytochrome C oxidase subunit II (complex IV). (D) Quantification of band densitometry normalized to the tubulin loading control. The data represent the mean ± SD of three independent measurements.


