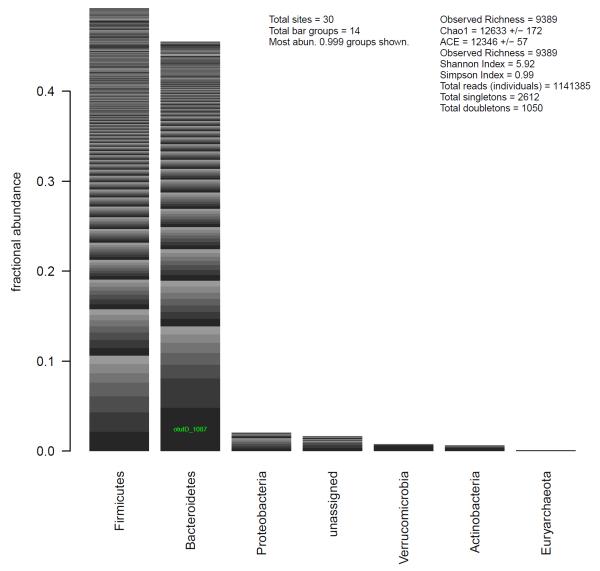
Fig. 2.
Example of a default plot method for summarizing an object of class otuSam-Tax. Each phyloseq class has a specialized plot method for summarizing its data. In this case, relative abundance is shown quantitatively in a stacked barplot by phylum. Different taxa within a stack are differentiated by an alternating series of grayscale. The OTU identifier of taxa comprising a large enough fraction of the total community, 5% in this case, is labeled on the corresponding bar segment. Several diversity/richness indices are also shown.

