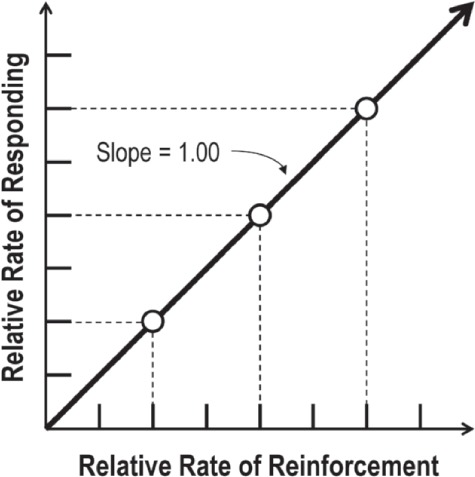
Figure 1.

Hypothetical plot of the relative rate of responding changing in perfect proportion to relative rates of reinforcement, that is, “matching.” The left side of Equation 1 captures relative rate of responding (y-axis), whereas relative reinforcement rate is captured by the right side of Equation 1 (x-axis).
