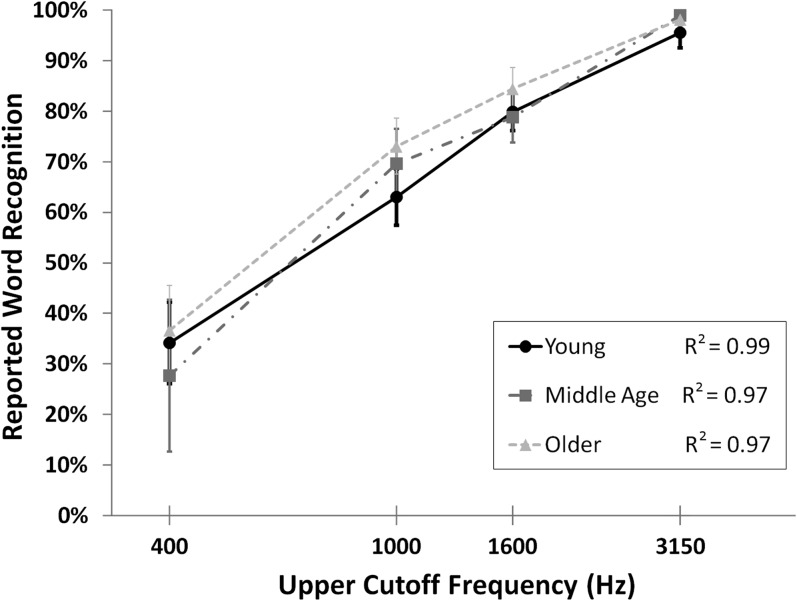
Figure 3.
The mean percent of words reported as recognized are plotted as a function of the upper cutoff frequency of the band-pass filter for each age group: young (n = 15), middle age (n = 6), and older adults (n = 15). The R2 value across participants is 0.99. Error bars represent the standard error of the mean.

