
Figure 4.
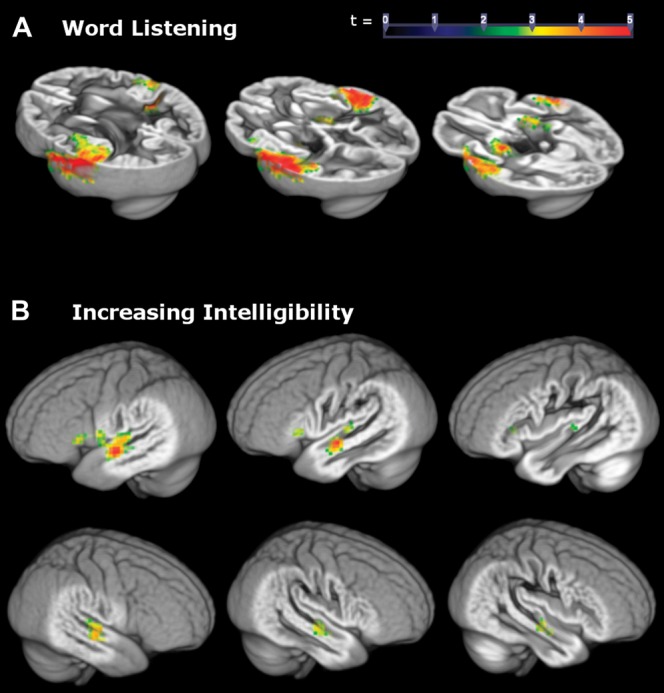
Clusters represent the magnitude of the relation between increased BOLD signal in temporal areas and (A) listening to words across all conditions and (B) increasing word intelligibility from the 400 to 3150 Hz condition. Peak and cluster extent thresholds were both set to P < 0.01.