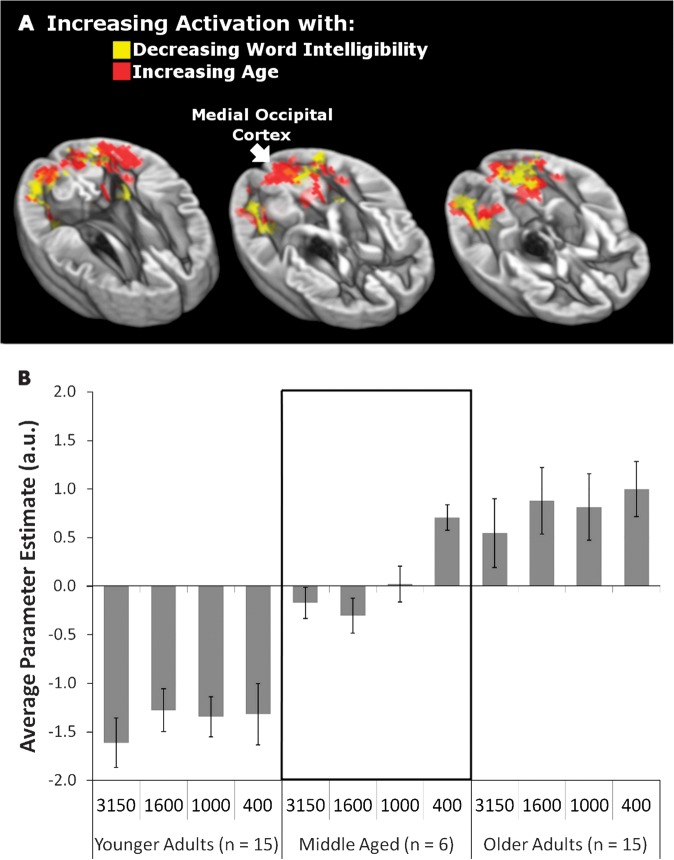
Figure 5.
(A) Parametric increases in activation with decreasing intelligibility (red) overlap with increases in activation with increasing age (yellow). Peak and cluster extent thresholds were both set at P < 0.01. (B) Parameter estimates represent activation in the medial occipital cortex region (identified with a white arrow in A). The mean parameter estimates for activation in this region are presented separately for each filter condition within younger (n = 15), middle-aged (n = 6), and older groups (n = 15). Positive values indicate activation of medial occipital cortex and negative values indicate reduced activation relative to an implicit baseline mean. Error bars represent standard error of the mean.

