Figure 2.
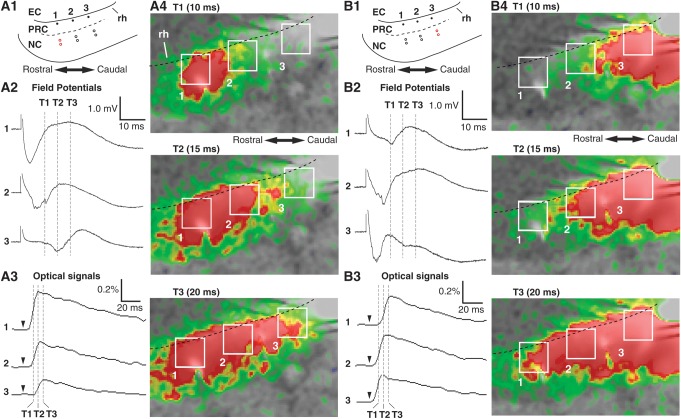
Area 36 responses to neocortical stimulation as measured with field potentials and optical measurements of voltage-sensitive signals. Panels A and B show area 36 responses to electrical stimuli delivered at the most anterior or posterior neocortical stimulation sites, respectively. The schemes in panels 1 show the stimulation (red) and recording sites. These neocortical stimuli elicited field potential (2) and optical responses (3–4). Panel 3 plots the fluorescence in all pixels included in the 3 square regions shown in panel 4 as a function of time. Arrowheads indicate when the stimulus was applied. The dashed vertical lines labeled T1–3 in 2 and 3 coincide in time. Panel 4 shows time-lapsed pictures of optical signals elicited by neocortical stimuli at the times indicated by the dashed vertical lines T1–3.

