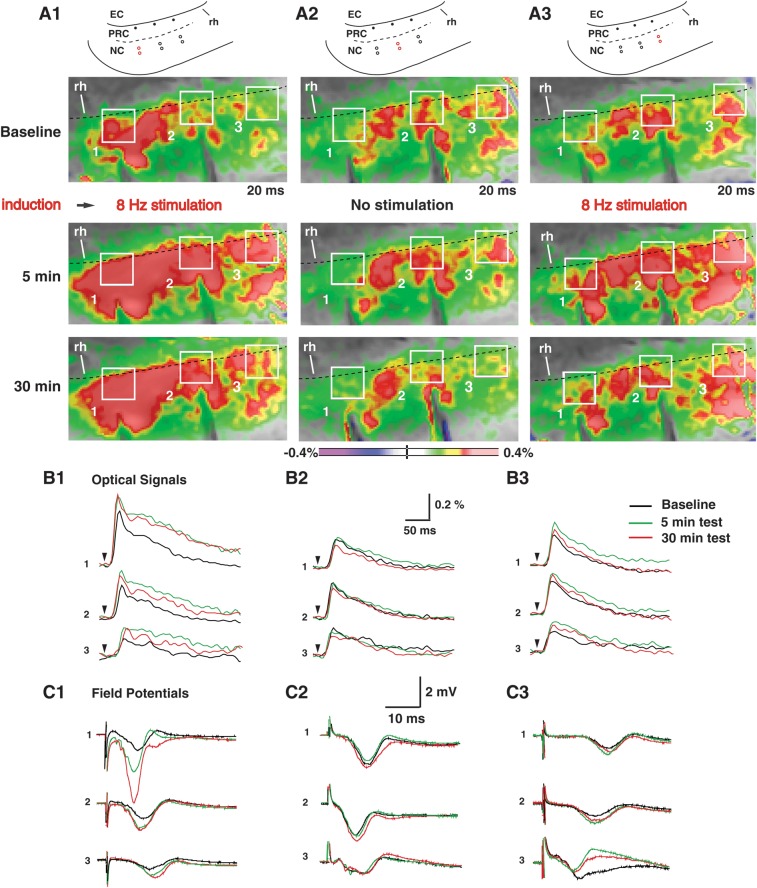
Figure 5.
TFS at 2 neocortical stimulation sites produces a long-lasting potentiation of responses evoked by the paired sites. (A1–3) Electrical stimuli were delivered in the neocortex at the sites indicated by red circles in the schemes (top). In the control phase (Baseline), single shocks were delivered at each site independently. During the induction phase, 2 of the sites (A1, A3, red circles) received TFS (8 Hz stimulation) while the third (A2, red circles) was not stimulated. Five and 30 min later, single shocks were delivered at all sites independently. The pictures in A show optical signals generated by the 3 neocortical stimuli (20 ms after the stimuli) during the control phases (top) as well as 5 (middle) and 30 min (bottom) after TFS. B plots the fluorescence in all pixels included in the 3 square regions shown in the pictures of panel A. Arrowheads indicate when the stimulus was applied. C shows the field potential responses elicited by the neocortical stimuli. In B and C, the black, green, and red lines indicate activity obtained during the control phase, as well as 5 and 30 min after TFS, respectively.

