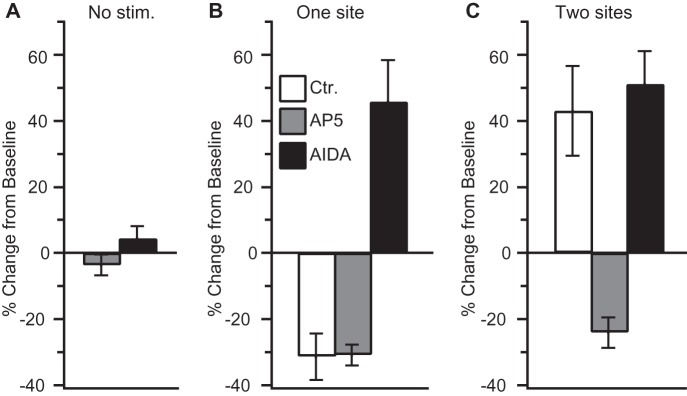
Figure 9.
Induction mechanisms of LTD and LTP. Percent change in field potential response amplitude (y-axis; normalized to baseline) with no TFS (A), with TFS applied at one neocortical site (B), or at 2 neocortical sites simultaneously (C). White, gray, and black bars indicate data obtained with control perfusate, AP5, or AIDA, respectively.

