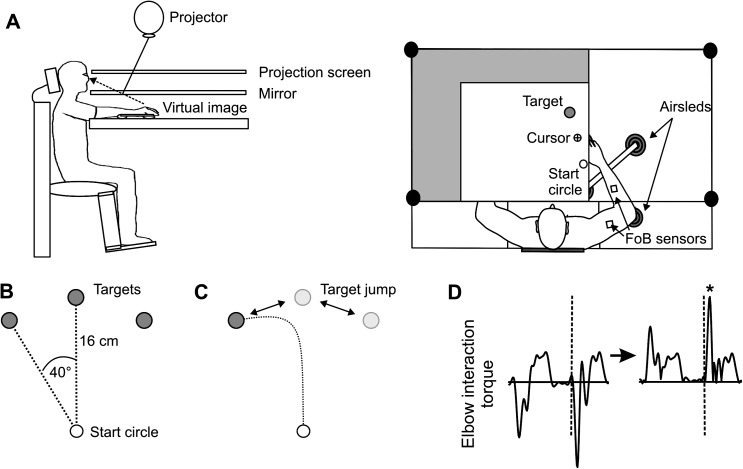
Figure 2.
(A) Side and top view of experimental apparatus are shown. (B) Baseline and (C) target jump locations in the lateral, center, or medial direction relative to the starting position. All targets were presented in the ipsilateral hemispace relative to the arm. (D) Schematic of computation for corrective interaction torque (x-axis = time). Calculated interaction torque is on the left. Arrow indicates full-wave rectification; dashed line indicates correction time; asterisk indicates value of peak corrective interaction torque.

