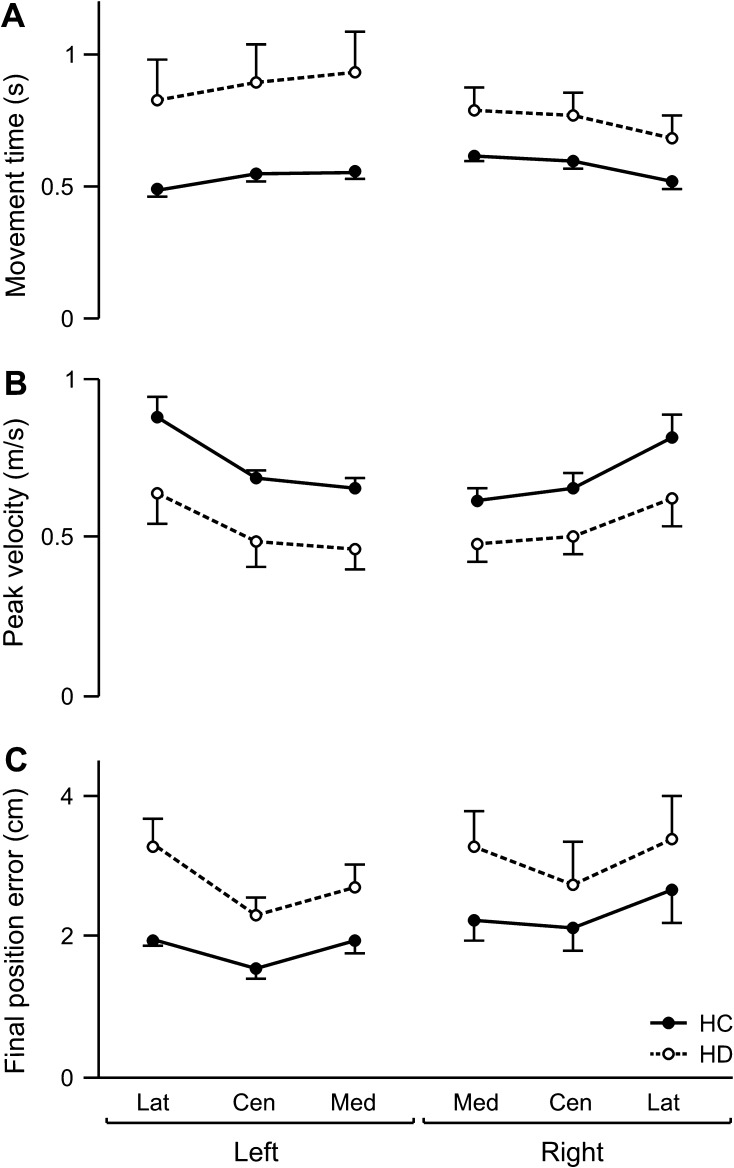
Figure 3.
Baseline performance. Mean (A) movement time, (B) peak tangential velocity, and (C) final position error for each target (Lat, lateral; Cen, center; and Med, medial location in ipsilesional hemispace) is displayed for the left and right arms of healthy control groups (LHC, RHC; solid line) and the ipsilesional arms of LHD and RHD groups (dashed line). Error bars indicate standard error.

