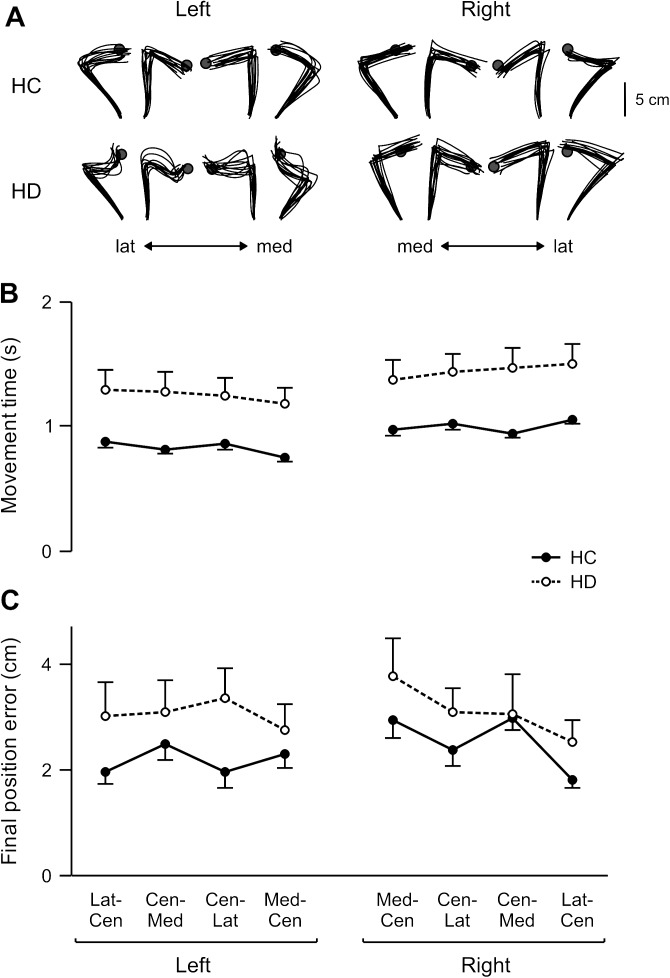
Figure 4.
Target jump performance. (A) Top view of handpaths for all target jump trials for individual HC and HD subjects. Mean (B) movement time and (C) final position error for each target (Lat–Cen, lateral to center; Cen–Med, center to medial; Cen–Lat, center to lateral; Med–Cen, medial to center) is displayed for the left and right arms of healthy control groups (LHC, RHC; solid line) and the ipsilesional arms of LHD and RHD groups (dashed line). Error bars indicate standard error.

