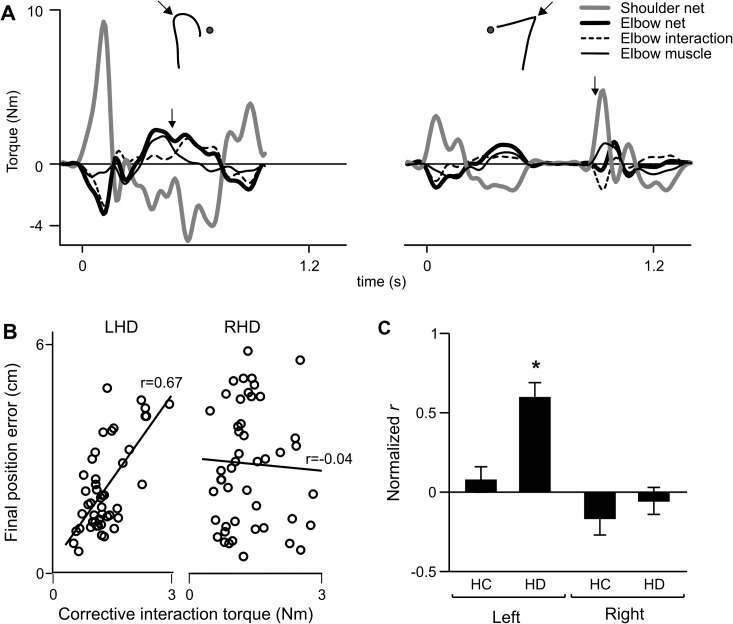
Figure 6.
(A) Torque profiles are shown for shoulder net torque (gray line), elbow net torque (thick black line), elbow muscle torque (thin black line), and elbow interaction torque (dashed line) during the individual target jump trials shown in Figure 5B for the LHD subject (left panel) and RHD subject (right panel). Corresponding handpaths are inset. Arrows indicate correction time. (B) Final position error of each target jump trial is plotted as a function of corrective interaction torque for an LHD and RHD subject, with corresponding Pearson r value. (C) Mean normalized Pearson r (Fisher z-score) of final position error versus corrective interaction torque is displayed for the left and right arms of healthy control groups (HC) and the ipsilesional arms of LHD and RHD groups (HD). Bars indicate standard error of mean. *Tukey's test: P < 0.05.

