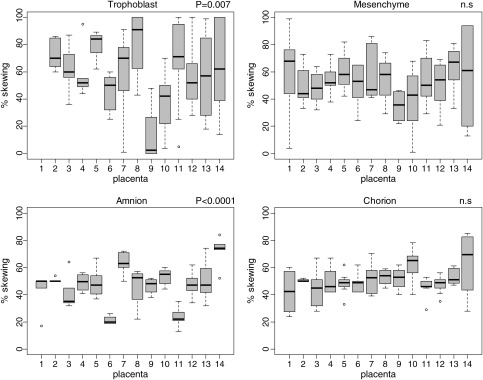
Figure 1.
Distribution of XCI skewing by placenta in different tissues. Box plot for each placenta (numbered on the x-axis) for amnion, chorion, trophoblast and chorion. Degree of skewing ranging from 0 to 100% is on the Y-axis. The P-value for the ANOVA to test for differences in means between placentae is given. The boxes represent the interquartile range (IQR) for XCI skewing values for the 4–9 sites analyzed per placenta. The whiskers demonstrate the last data point within ± 1.5 times the IQR. The bars indicate the medians and the dots show the outliers.

