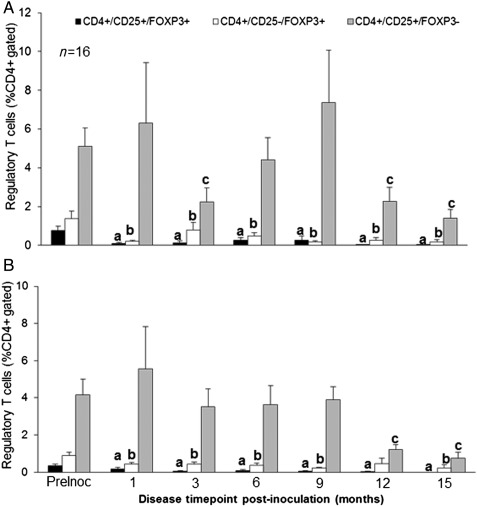
Figure 3.
Peripheral Treg populations following disease induction in baboon. Peripheral blood samples were collected during the (A) proliferative, (B) mid-secretory phase of the menstrual cycle at each surgical time point post-inoculation of the disease. Percentage histology is shown for all CD4+-gated cells. All animals were normalized to their pre-inoculatory levels. Significance is indicated by different letters from preinoculatory measurements for all Treg sub-types. n = 16, P < 0.05, error bars indicate SEM.

