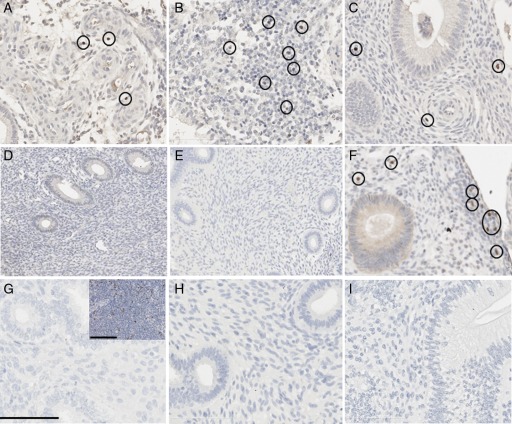
Figure 5.
Foxp3+ cell localization in the baboon eutopic endometrium. Eutopic endometrial biopsies from 1 month (A, D), 6 months (B, E, H) and 15 months (C, F, I) were analyzed for control animals (A–C), animals receiving a 1-month operational procedure (D–F) and animals receiving a 6-month operational procedure (H & I). G, IgG isotype control; inset, positive control lymph tissue. Foxp3+ cells are circled. Scale bar = 100 μm.

