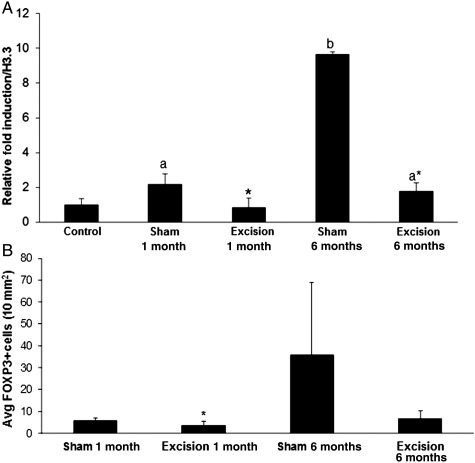
Figure 6.
Foxp3 transcript levels (A) and Foxp3+ cells (B) in baboon ectopic endometrium. Ectopic lesions were collected at 15 months post-inoculation and Foxp3 transcript levels were determined through qRT–PCR (A) and Foxp3+ cells were labeled through immunohistochemistry (B). (A) Transcript levels were normalized to endogenous control H3.3 expression and expressed as a relative fold induction over control eutopic endometrial Foxp3 expression. (B) The number of Foxp3+ cells was averaged and then normalized to a 10-mm2 area. Significance of animal operational treatments versus controls is indicated by different letters. Significance between sham versus excision treatment within each time point is indicated by asterisk (*). n = 7 (controls), n = 4 animals/group and at least two lesions/animal for diseased animals, P < 0.05, error bars indicate SEM.

